BTC
BTC
 ETH
ETH
 LTC
LTC
 BCH
BCH
 DOGE
DOGE
 USDT
USDT
 DASH
DASH
 XRP
XRP
 USDC
USDC
 XMR
XMR
 BNB
BNB
 TRX
TRX
 SHIB
SHIB
 DAI
DAI
 ZEC
ZEC
 SOL
SOL
 ETC
ETC
 POL
POL
 XLM
XLM
 ADA
ADA

Ethereum has maintained its bullish momentum as its price rises towards $4,000, a key resistance and psychological level. As an example, on 1 December ETH reached $3,727.27 in the morning session, as the market anticipates its upward price movement to continue until it surpasses $4,000.
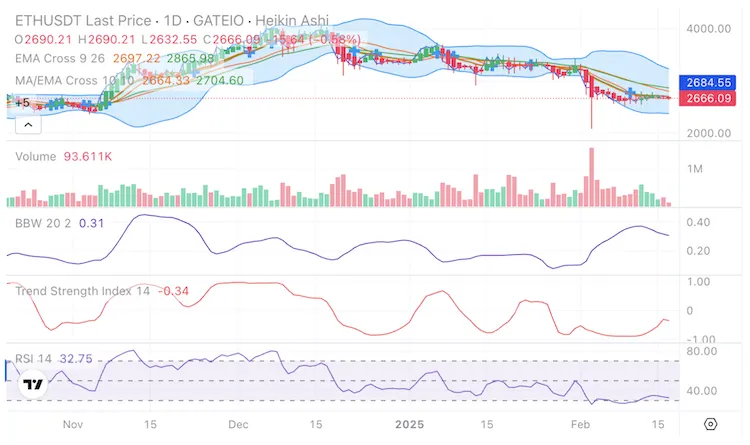
At the time of writing trade ETH perpetual contract at $2,696 ETH/USDT on Gate.io exchange. This follows its strings of gains during the past 30 days. For instance, its value increased by 9.1% during the past 14 days and down by 16.7% within the previous 30 days. The graph below summarizes the Ethereum price action during the past week.
ETH Weekly Price Chart - Gate.io
As seen in the graph, ETH is within an uptrend which started on 4 February. However, on the way it has faced some dips and bounces. That uptrend started after it had a long sideways move that began on 5 August. As the data shows ETH has established a strong support area around price $3,500. This indicates that its price might not drop below that level for some time. This also confirms that the investors have confidence in the crypto asset at this time. Notably, the graph depicts that the number one altcoin is within a strong recovery phase which may lead its price to break above the $4,000 level. It is also important to note that the ETH trading volume has been above average for the greater part of the mentioned period. The high volume shows that there is a general rise in the level of engagement in the Ethereum market. In other words, the trend shows that currently the investors have a long-term investment focus rather than short-term speculation.
Other ETH market statistics indicate that the asset is within a consolidation phase and maintains bullishness. As an example, the ETH CME futures open interest (OI) has remained high since the United States presidential elections. This shows that U.S investors have much confidence in the altcoin. Also, during the same period the ETH ETFs have been recording high inflows. That has created a positive market sentiment for the coin. Therefore, if the ETH ETF inflows and CME open interest remain high the Ethereum price may surpass $4,000 during the year.
ETH Price History
Since the beginning of November ETH has been performing well which injected confidence in the altcoin sector. For example, during the period the cryptocurrency broke above several resistance levels that include $3,000; $3,100 and $3,200. When these price levels flipped into support levels it became difficult for the price to have a free-fall. For instance, on 21 November its value rose to $3,360. Nevertheless, the rise in selling pressure a day later forced its price to fall to $3,328. From there it surged past $3,700 on 1 December. Sadly, the bulls could not hold that level resulting in its price to drop again.
The Significance of ETH Surpassing $4,000
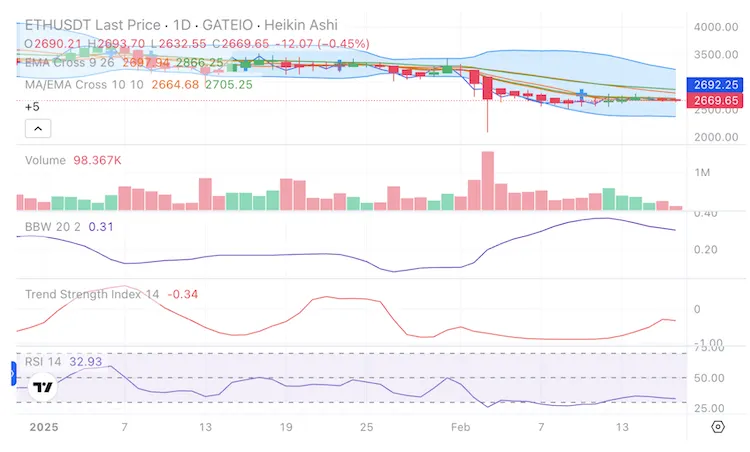
The $4,000 psychological resistance level holds much significance for the asset as well as for the entire altcoin sector. An analyst Rekt Capital recently said that if the ETH price surpasses $4,000 there will be a surge in capital inflow into ETH and other altcoins. That may have a positive effect on the entire cryptocurrency sector. The main reason is that the confidence in crypto assets will increase once leading assets like ETH and Bitcoin reach key levels. In a similar manner, the analyst said that once the ETH price breaks above the $3,000 mark it will target $3,500 ETH/USDT. At the moment, ETH remains bullish both in the lower and higher time frames. The next graph indicates its current price action.
ETH Dail Price Chart - Gate.io
As the picture shows ETH is within an uptrend that is denoted by the rising wedge. Generally, the rising wedge is a bullish candlestick chart pattern. Once It breaks above the upper trendline its price may reach $3,000. However, there is a bearish divergence between price and volume. That shows a possibility of a pullback in the near future. Let’s look at the technical indications of the next graph.
ETH Price Chart - Gate.io
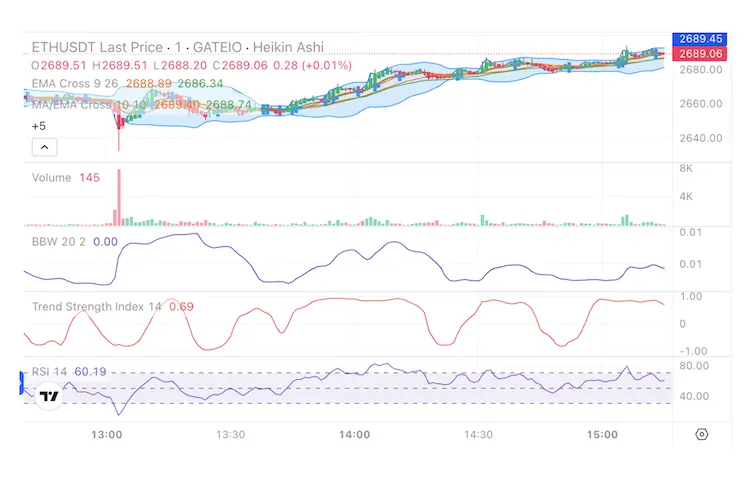
The ETH price chart above shows that the altcoin has had a golden crossover. This is because the 50-day EMA (green) crossed above the 200-day EMA (red.) As you might know, the golden cross is a strong bullish signal. That is particularly important if it is on a high time frame such as the daily price chart. It is essential to note that ETH last retested the $4,090 level on 11 March. On the other hand, it attained its all-time high of $4,891.70 on 16 November 2021. What is worrisome at the moment is that Ethereum trading volume decreased by 20.47% during the past 24 hours. This shows that its uptrend may be weakening.
Ethereum Price Prediction in 2025
We have already hinted on ETH price prediction. As Rekt Capital said ETH may reach $4.500 this season if it breaks above $4,000. Changelly, Gate.io forecasts the ETH price to reach $4,773 ETH/USDT by the end of the year. This analytic platform confirms that ETH is within a bullish period as it has a Fear and Greed Index of 84. This metric indicates that there is high buyer interest in the ETH market.