When it comes to trading, charts are the bread and butter of any trader. They are the tools that traders use to make sense of the market and make decisions about when to buy and sell. Among the many different types of charts, footprint charts stand out for their ability to provide a detailed, real-time view of market activity.
In this article, we explain everything there is to know about footprint charts, exploring what they are, how they differ from candlestick charts, and how traders can use them to improve their trading.
What Are Footprint Charts? Understanding the Inner Workings
Footprint charts, also known as order flow charts, display the buying and selling activity of a financial instrument in real-time. They show the number of trades that have taken place at each price level and can be used to identify patterns and trends in the market. Unlike other types of graphs, such as candlestick charts, which only show an instrument's opening, closing, high, and low prices, footprint charts provide a more detailed view of market activity.
How Are Footprint Charts Different from Candlestick Charts?
Candlestick graphs and footprint charts may look similar at first glance, but they are actually quite different. While candlestick charts focus on the price movements of an instrument, footprint charts focus on the activity of buyers and sellers.
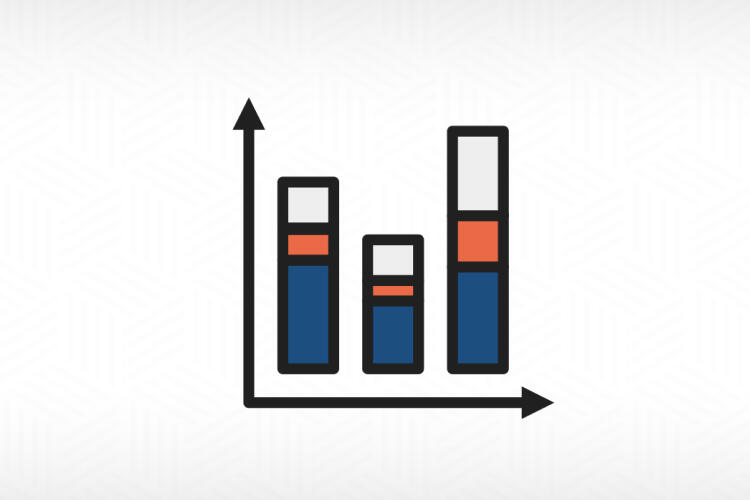
Candlesticks show an instrument's opening, closing, and high and low prices and are used to identify patterns and trends in price movements. Footprint charts, on the other hand, show the number of trades that have taken place at each price level and can be used to identify patterns and trends in the market.
Can You Use Footprint Charts in Crypto and Forex Trading
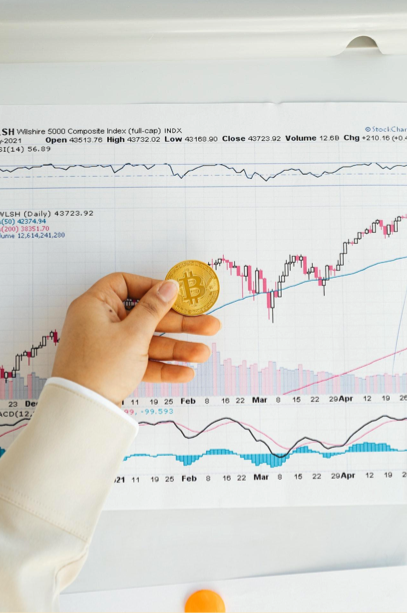
Flow graphs can be used in both forex and crypto trading to gain a deeper understanding of market activity. By providing a detailed view of buying and selling activity, traders can use these graphs to identify patterns and trends that may not be visible on other types of charts.
In forex trading, for example, traders can use them to find areas of support and resistance and to figure out whether the market is moving in a trend or just going back and forth. In crypto trading, traders can use them to find patterns in buying and selling, like when a lot of people are buying or selling at the same time.
How to Use Footprint Charts in Forex & Crypto Trading?
Before using these graphs, you need to understand how to read them. Familiarize yourself with the chart's different colors, bars, and lines, and understand what they represent.
● Identify Patterns And Trends: Once you understand how to read a chart, start identifying patterns and trends in the market. Look for support and resistance areas, as well as when the market is trending or ranging.
● Use Multiple Timeframes: It can be viewed on multiple timeframes, from minutes to months. Use this feature to your advantage.
● Use Indicator: They provide order flow indicators that can help you identify key market conditions.
● Paper Trade: Practice using a footprint chart with a paper trading account before trading with real money. This will give you a chance to get a feel for how the chart works and how to use it effectively.
Strategize for Success: Trading Plan with Footprint Charts
To use these tools well, you need to devise a plan that considers the unique information they give you. This can be done by using multiple time frames, spotting key patterns and trends, and using indicators to spot key market conditions.
One strategy that can be effective is to use them to identify areas of support and resistance and then use this information to make decisions about when to enter and exit trades. For example, if you notice a large number of trades taking place at a specific price level, this could be an indication that this level is acting as a strong area of support or resistance.
Another way to use them is to find patterns in buying and selling, like when a lot of people are buying or selling at once. This can help you identify potential market turning points and decide when to enter or exit trades.
Ending Thoughts
Footprint charts are a powerful tool that traders can use to learn about the market and make smart trading decisions. By learning how to read and use them, traders can gain a deeper understanding of market activity and use this information to develop effective trading strategies. While it may take some time and practice to master the use of footprint charts, the insights they provide can be well worth the effort.